Public Transit, Walkability & Wealth
Statistical analysis of the relationship between rail transit access, Walk Score, and housing values across five Southern US cities.
- R
A research project (SOCI 460, Rice University, co-authored with Langston Ford) examining how rail transit accessibility and neighborhood walkability correlate with median home values in Atlanta, Dallas, DC, Houston, and Miami.
Read the full paper: Who Gets to Live Near Rail Transit? Effects of Rail Transit Access and Walkability on the Housing Market in Large Southern Cities.
Methodology
Built a data pipeline in R across five cities (Atlanta, Dallas, DC, Houston, Miami) at the census block group level:
- Data sources: IPUMS NHGIS (block group shapefiles, income and home value from the ACS 5-Year survey), transit agency GTFS feeds for rail station locations, the Walk Score API, and Google’s Geocoding and Routes APIs.
- Pipeline: filtered and joined shapefiles per city, computed each block group’s representative “interior point,” reverse-geocoded it, then queried Walk Score and actual walking distance (not straight-line) to the nearest rail station via Google Routes.
- Modeling: OLS regression across multiple distance thresholds, then tested for spatial autocorrelation with Moran’s I (queen contiguity weighting) and corrected for it with a spatial autoregressive (SAR) lag model, estimated via maximum likelihood.
Once spatial autocorrelation was properly modeled, walking distance to transit lost statistical significance on home value in every city — the naive OLS regressions had been overstating the effect.
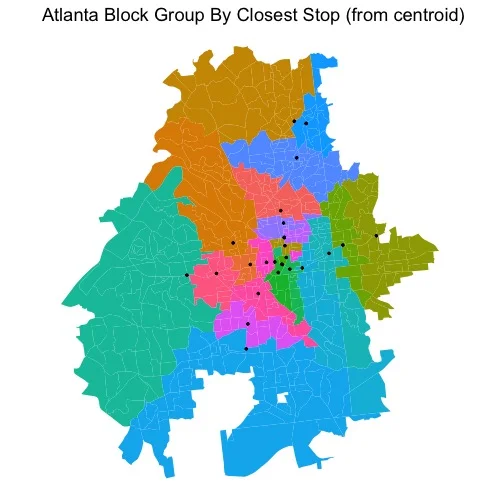
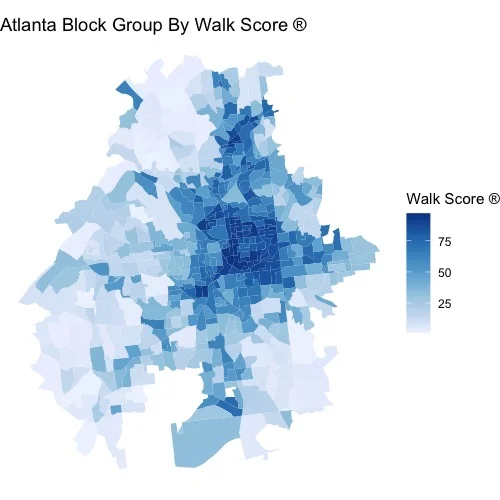
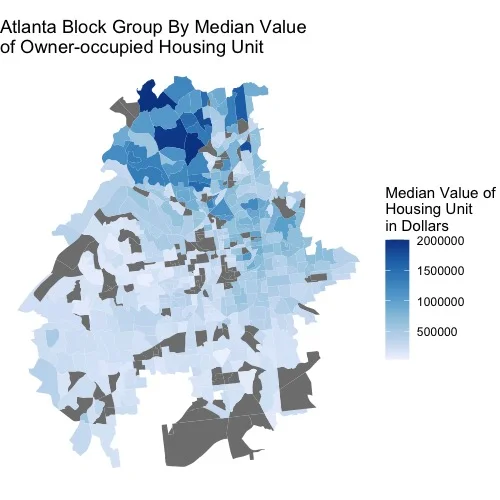
A few plots from Atlanta: